Track Your Online Business Growth with Zetpy’s New Sales Performance Report
Managing orders across multiple sales channels is only one part of running an e-commerce business. Sellers also need a clear way to understand their sales, order volume, and fulfilment performance.
To make this easier, Zetpy is introducing the new Sales Performance Report.
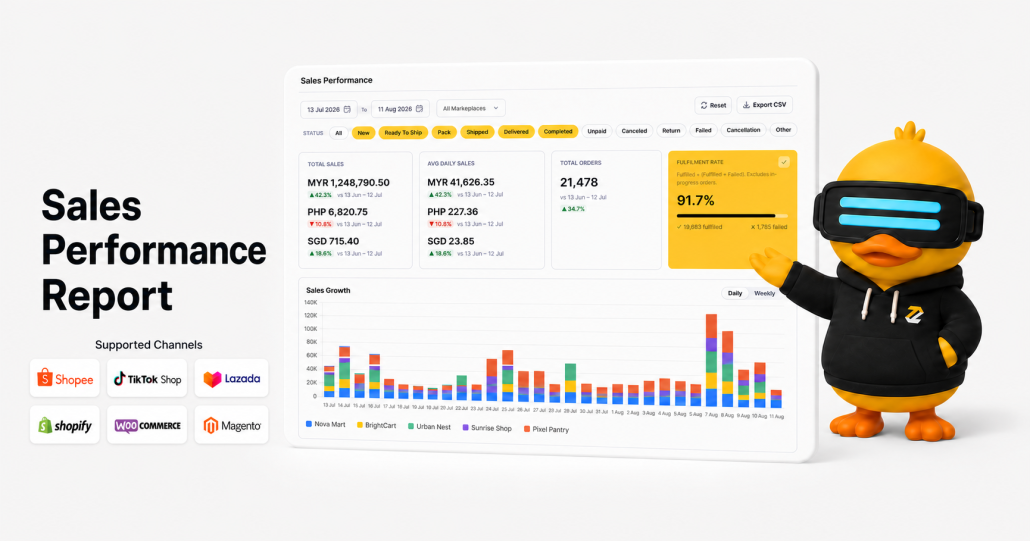
This report brings important sales information from your connected marketplaces and webstores into one dashboard. Sellers can review sales growth, compare channel performance, track order fulfilment, and identify business trends without checking each sales channel separately.
The Sales Performance Report supports Shopee, TikTok Shop, Lazada, Shopify, and WooCommerce, giving multichannel sellers a clearer view of their business performance in one place.
How the Sales Performance Report Benefits Multichannel Sellers
With the Sales Performance Report, you can:
- View sales in one place: Spend less time checking reports from different sales channels.
- Compare channel performance: See which marketplaces, webstores, and accounts contribute the most sales.
- Spot sales trends: Review daily or weekly sales patterns and identify when sales increase or decrease.
- Filter orders by status: Focus on specific order statuses, including New, Shipped, Completed, Cancelled, Return, and Failed.
Get a Clear Summary of Your Sales Performance
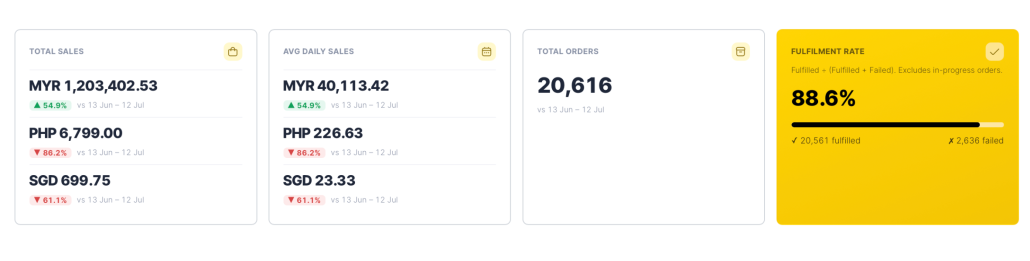
The Sales Performance Report gives you a quick summary of four important areas:
- Total Sales: The total sales value recorded during the selected period
- Average Daily Sales: The average amount of sales generated each day
- Total Orders: The number of orders recorded during the selected period
- Fulfilment Rate: The percentage of successfully fulfilled orders compared with fulfilled and failed orders, excluding orders that are still in progress
Monitor Your Order Fulfilment Rate
Strong sales performance is not only about generating more orders. Sellers also need to make sure those orders are fulfilled successfully.
The Sales Performance Report shows your overall fulfilment rate together with the number of fulfilled and failed orders.
If the number of failed orders increases, your team can investigate possible stock, processing, or operational issues.
Visualise Your Sales Growth
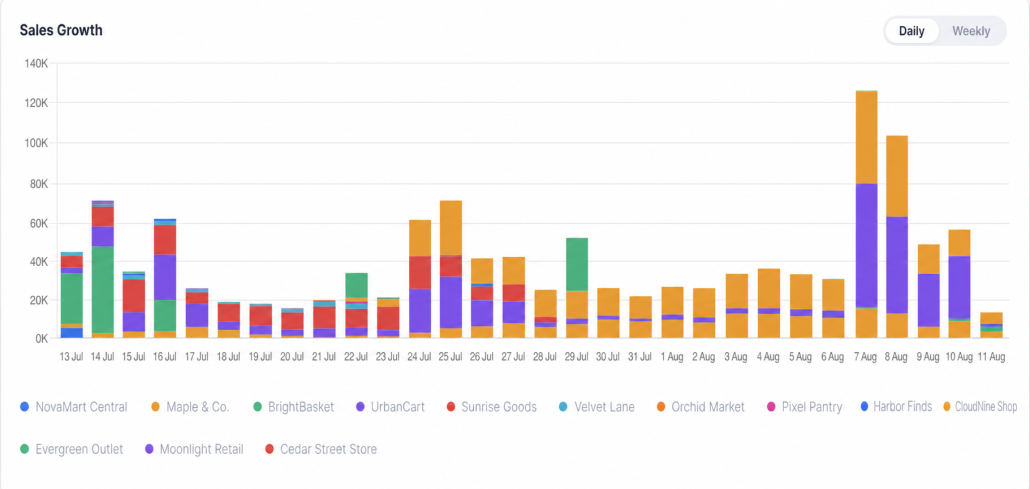
The Sales Growth chart gives you a visual overview of how your sales change over time.
You can switch between daily and weekly views to identify:
- High-performing sales periods
- Sudden increases or decreases in sales
- The contribution of different shops and sales channels
This helps you understand when sales are growing and which shops or channels are contributing the most.

Filter the Information You Need
You can filter the Sales Performance Report by:
- Date range
- Marketplace
- Account or channel
- Order status
Order-status filters include New, Ready to Ship, Pack, Shipped, Delivered, Completed, Unpaid, Cancelled, Return, Failed, Cancellation, and Other.
These filters allow you to focus on a specific part of your operation. For example, you can review completed orders for sales analysis or check failed and cancelled orders for possible fulfilment issues.
Export Your Report When Needed
Need to perform further analysis or share the information with your team?
You can export the Sales Performance Report as a CSV file. The exported data can support internal reporting, campaign reviews, sales analysis, and business planning.
Book a Free 1-on-1 Demo to see the Sales Performance Report in action!